#203 McKinsey Long Range Outlook

Since its founding 30 years ago, the McKinsey Global
Institute has explored key trends shaping business and the
economy. In 2020, COVID-19 paused some of those trends,
accelerated others, and added a new set of risks and
challenges.
See: https://www.mckinsey.com/featured-insights/innovation-and-growth/twelve-highlights-from-our-2020-research
----------------
As average temperatures rise, acute hazards such as heat waves and floods grow in frequency and
severity, and chronic hazards such as drought and rising sea levels intensify. The impact of these
hazards is non-linear and can have severe knock-on effects. Global average temperatures are expected to increase between
1.5 and 5 degrees Celsius relative to today in many locations by 2050.
-------------------
Economic outcomes in the past 20 years have varied widely. While employment rose, wages stagnated
for many, and the rising cost of housing, healthcare, and education eroded income gains. More expensive: Large increases in the cost of basics including housing,
healthcare, and education absorb income gains for many. Housing accounts for about 24% of
household consumption and its cost has
risen faster than general consumer prices. Less expensive: Prices of discretionary goods and
services such as communications and clothing fall significantly.
---------------------
Even early in the crisis, the
economic of COVID impact in the United States could
exceed any event since World War II.
CEO surveys suggest that the pandemic has
accelerated adoption of digitization and
automation. Job growth in the United States and Europe
is concentrated in a small number of
dynamic cities and counties. Automation
could accelerate the unemployment trend.
The burst of remote work during the pandemic is unlikely to continue at the same level, but some
occupations have considerable potential to work from home in hybrid models several days each week
without losing productivity. Three-quarters of the time spent on
activities in fi
nance and insurance can be
done remotely without a loss of productivity.
---------------------
Women make up 39 percent of global
employment but account for 54 percent of
pandemic-related overall job losses. The pandemic had an especially significant eff
ect on certain demographic groups. For example, our analysis
showed that women’s jobs were 1.8 times more vulnerable to this crisis than men’s jobs. One reason: the
virus significantly increased the burden of unpaid care, which is disproportionately carried by women.
---------------------
Fewer health conditions and expanded participation in the labor force
could increase global GDP by about 8 percent by 2040. The global disease burden could be reduced
by about 40% through broader application
of known interventions.
----------------------
Biology-based innovation is
transforming what we eat,
what we wear, and the way
we build our physical world. Science already feasible today could transform sectors from agriculture and
consumer goods to energy and materials. A visible pipeline of ~400 applications could
deliver direct annual economic impact of up
to $4 trillion over the next ten to 20 years.
------------------------
How Asia can boost
growth through
technological leapfrogging
Asia has been building its technological capabilities and infrastructure. More is to come based
on the scale of markets and investment and the speed of technology adoption, as well as
through intellectual property creation. Asia has a strong presence in 11
technologies in startup investment,
ten in IP creation, and four in both.
------------------------
Beyond the 5G revolution, an
evolution in connectivity is
boosting digital access worldwide
The next generation of connectivity technologies and upgrades to existing networks
worldwide could create trillions of dollars in major sectors across advanced economies while
bringing two billion new internet users online in the developing world. The share of global population remaining unconnected
or under-connected should be reduced by half by 2030. Greater flows of information, communication,
and services could add another $1.5 trillion to
$2 trillion to global GDP.
---------------------------

#202 Dollar as the Dominant Global Currency


#201 Balancing the Budget Trough Tax Reductions

The prospects that the US national budget would rebalanced depends on a cut in federal spending. The current budget deficit would have to be reduced. Is that possible?

--------------------------------------------------

 Although the total tax revenue of $3.5 Trillion can not substitute for the post COVID GNP gap, increasing individual taxes and some payroll tax reductions will be on the agenda for the new administration. Only 7% of corporate taxes from corporations show a disproportionate allocation of taxation for the dividend-earning part of the high earning population that is not likely allocate income to the growth of the economy.


The USA has the world's largest GDP and the ratio of its public debt to GDP remains at tolerable levels. However the public debt of China is even lower and its external debt is already the lowest in the world.
-------------------------------------------------

----------------------------------------------------

The top income quintile and particularly the top 1% will be targets for increased taxation of incomes. However, the large accumulation of assets (> 50% of wealth) will be among the top 1% will most likely be the targets. As the workforce declines there will be no incentives to raise payroll taxes.
----------------------------------------------------
#199 Global Statistics


The huge decline in fertility rates from an average of 5 children/woman in 1965 to 2 children/woman largely reflects increased progress in childcare to rising survivability of born children.
-------------------------------------

The world population increased from 2.5 billion in 1950 to 7.9 billion in 2020. That is an addition of 5.4 billion people in 70 years, or a 216% gain.
For the remainder of this century, or 80 years, the world population will level off at 11 billion. That is an addition of 3.1 billion people, or a 39% gain.
The huge increases in the global population during the past 70 years will never be matched again by increases in the next 80 years.
-------------------------------------

As the population ages and the number of people in the workforce declines it will require increased welfare payments for an economy to support the aging population. That will require more taxes and immigration from low-wage countries.
-------------------------------------

A snapshot of the evolution in GDP/capita in 500 years. There was no growth for 300 years until the end of royal control. Afterwards industrialization boosted growth for 120 years followed by US dominance for 70 years and ending in 2020 with a financial crisis.
--------------------------

The global population is aging. After 2017 the growth of people over 65 more than double to number of new children,
#200 November 26 2020 USA Assessment

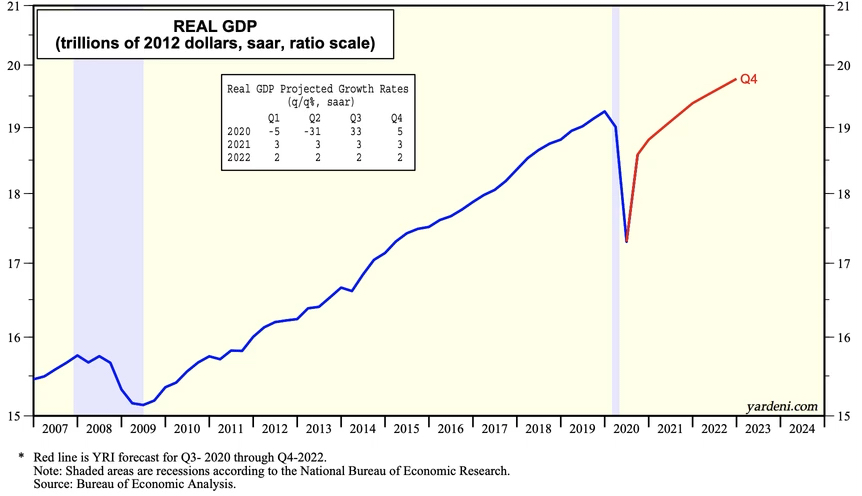
The current BEA forecast projects recovering to the prior peak of $19.5 trillion by the end of 2021. The prior projected levels of $21 trillion are not reached until sometime after 2025.
How credible is the BEA forecast? It presumes the resumption of the GDP at rates at least equal to the 2014-2018 period when GNP was stimulated by steep increases in debt, a rise in the budget deficit and huge trade deficit.
We doubt the BEA forecasts because a recovery from unemployment cannot take place without an unaffordable increase in debt or a massive upward shift in workforce participation. There are many GDP downward drafts we will track, such as increases in the unemployment in clerical and administrative positions, reduced corporate profits from increased taxes and the continuation in deficit balances both in trade and federal government.

Personnel over the age of 55 will be showing the most decline as younger and less expensive workers will displace the largest part of the workforce. As government funded retirement pay vanishes, the traditional demographic patterns will disappear.


#198 - Old Age Demographics


After 2020 the global population will be dominated by people over 65 years old as the population of children under age if 5 will keep shrinking. The higher rate of increase of old people reflects their increasing life expectancy.
------------------------------------------------

US average life expectancy increased from 63 in 1940 to 78 in 2018. People living until the age of 65 will have an additional 6.5 years to live.
------------------------------------------------

In 1955 it took approximately 12 workers to generate the social security funds needed to support one person over the age of 65.
In 2099 it required at least 2.8 workers to support one old person. This shift in dependency ratios indicates that the productivity of the entire global workforce would have to rise by at least 430% more in order to deliver equivalent old age support benefits as they were in 1955.
------------------------------------------------
#197 Investing in Alibaba

On 11/21/2020 there is a question whether invest in the Alibaba corporation, now traded on Vanguard, to finance future retirement needs. The objective is to diversify depreciating dollar funds into a small share of rising China equities.

Though Amazon has 4.5x more revenue and started in 1994, Alibaba is more profitable but started in 1999. The big difference is in employees: Amazon has 798,000, Alibaba only 103,690. Alibaba has >755 million customers in >2.5 billion market place as compared with Amazon's >2 million an >0.4 billion. One characterize Alibaba as a tortoise and Amazon as a hare. Fundamental long term investment choice for a conservative investor: Alibaba.
--------------------------------------------------------------------------------––-

For a the long run Alibaba investment strategy is fairly valued. Current financial indicators are positive except that the gross margin has been declining.
--------------------------------------------------------------------------------––-

Another view of the short term difference in the spread in Alibaba stock prices is shown below:

--------------------------------------------------------------------------------––-.
As an added precaution we also examined the trends in revenues and in Alibaba profits:

Short term trend line confirm that both revenue and profits are consistently positive and that past trends are likely to continue. The only risk arises from government intervention to cut off trading on the NY stock exchange.
SUMMARY: Continue weekly >10 shares purchases of Alibaba if price >$290/share.
SOURCE OF DATA: https://www.gurufocus.com/stock/BABA/summary
#196 China Statistics

China’s economic data system is a work in progress and a hurdle that statisticians have yet to overcome. The Chinese NBS could improve its system by offering greater transparency behind the data-gathering process and statistical procedures, allowing data users to better identify weaknesses in the official numbers. But the heavy criticism of Chinese officials and accusations of intentional falsification or manipulation are likely misplaced. The truth is more likely that economic growth in China is too challenging to capture as effectively as growth in developed countries.
See reference article from analysts of the Federal Reserve Bank:

---------------------------------------------------------------------------
.

China has recovered +6% of GDP growth since the 2020 pandemic.
----------------------------------------------------------------------

China's trade balance (e.g. Exports minus Imports) as been consistently positive. The current rate amounts to >$400 billions, down from a peak of >$600 billions in 2015. Countries with a positive trade balance are enriched, countries with a negative trade balance are becoming impoverished.
----------------------------------------------------------------------
.

China has shifted its land exploitation low-productivity workforce from 90% rural in 1950 to 40%. The increasingly high-productivity workforce became increasingly industrial based, moving from 10% in 1950 to 60% in 2019 where continues to grow.
----------------------------------------------------------------------
----------------------------------------------------------------------

Chinese population growth diminished from 200 million per ten years in 1975 to 4 million in 2019. The annual growth rate declined from 3% in 1975 to the current 0.35.
----------------------------------------------------------------------

#194 A Review of Surprising USA Statistics


The USA birthrate has remained on the average of 4 million/year since 1939. The current birth rate is only 12 births per 1000 people or 0.09%. The population growth rate is 0.6% which suggests that the growth in the population is due to immigration, not birth. Legal immigrants now constitute >14% of the population.
-------------------------------------

There are 44.7 million legitimate immigrants in the use or 13.7% of the government recorded population. A large share (40%?) come from impoverished South American countries and constitute a significant share of population in the lowest quintile of income.
-------------------------------------

The US labor force participation rate has declined from 51% in 1980 to 35.5% in 2010. The rise from 1962 to 1980 reflects the entry of women into the workforce. The decline since 1980 reflects a decrease in the share of young people in the workforce as the immigrants are of a more mature age and as the distribution by age shifting to older people.
-------------------------------------

As the US population increases the savings rate decreases. Increased amounts of government benefits reduces unemployment while low wage immigrants can find employment.
-------------------------------------

The rising optimism and an increasing trust in future by the top earning 1% is reflected in the rising disparity between the stock market and the forward cash earnings of corporations.
-------------------------------------

The rise in imports as compared with diminishing exports shows that in terms of international trade some of the USA assets are losing value.
-------------------------------------

Since 2001 there has been a large increase in the Federal deficit.
-------------------------------------

The disparity in US income shows up as follows: The lowest 20% quintile of the population earns 3% of the total. The next quintile (20-40%) earns 9%. Next quintile (40 - 60%) earns 14%. The top ranked 20% quintile of households receive 52% of income.
Income-based comparisons are inadequate. The difference in quintiles is much greater when the share of assets is ranked.
-------------------------------------

Upper income households increased their share of income from 29% in 1979 to 48% in 2018 while the share of middle income households declined from 62% to 43%. Lower income households declined from 10% to 9%.
-------------------------------------

While trend in the share of GDP of personal income declined slightly, the government social benefits compensate persons with grants of social benefits.
-------------------------------------

The current administration made up budget deficits by means of a steep rise in treasury debts obligations.
-------------------------------------

Investments in USA structures have risen from $220 billion in 1960 to $430 billion in 2020 and leveling off since 1980. However, intellectual property products have increased during the same time from $25 billion to $1,000 billion and keep rising. Consequently the USA GDP assets are now dominated by intellectual property (soft assets). Hard assets (equipment) is now dependent on intellectual assets that are easily exported.
-------------------------------------

Wealth countries (G7) are declining in the importance of global trade. Emerging countries (mostly the rest of world)) the gainers in global trade.
-------------------------------------
The huge decline in fertility rates from an average of 5 children/woman in 1965 to 2 children/woman largely reflects increased progress in childcare to rising survivability of born children.
-------------------------------------
The world population increased from 2.5 billion in 1950 to 7.9 billion in 2020. That is an addition of 5.4 billion people in 70 years, or a 216% gain.
For the remainder of this century, or 80 years, the world population will level off at 11 billion. That is an addition of 3.1 billion people, or a 39% gain.
The huge increases in the global population during the past 70 years will never be matched again by increases in the next 80 years.
-------------------------------------
As the population ages and the number of people in the workforce declines it will require increased welfare payments for an economy to support the aging population. That will require more taxes and immigration from low-wage countries.
-----------------------

Dalio/Toynbee view of history cycles. Accordingly the USA is now on a down part of the pattern of civilizations.
-----------------------

Displays how civilizations drift in historical cycles.
-------------------------
 |
| The fracture of the US society: A drift to a more conservative (more nationalistic and more right wing - e.g. republican view). ---------------------  That shows rising inequality! Similarly the difference in income is 47% for the top 10% of families. What matters is the inequality in wealth, not income. ----------------------- |
Subscribe to:
Posts (Atom)